These guides cover the basics of understanding and configuring Kruncher for portfolio management.
GUIDE INDEX- Automated Watchlist Monitoring
- Complete List of Signals
- Customizing Tracked Signals
- Growth Score, Signals, Alpha Engine
Automated Watchlist and Portfolio Monitoring
After an initial Match, the company often goes to your watchlist for some time before you make a decision.
Kruncher also automates both your watchlist and portfolio monitoring with over 438 recognized metrics and signals that it tracks.
An additional layer of intelligence also works out what is important, ensuring that you only get key updates and not minor, noisy notifications.
Monitoring then becomes systematic, tailored to each company, and ready for partners, boards, and LPs, without manual spreadsheet work.
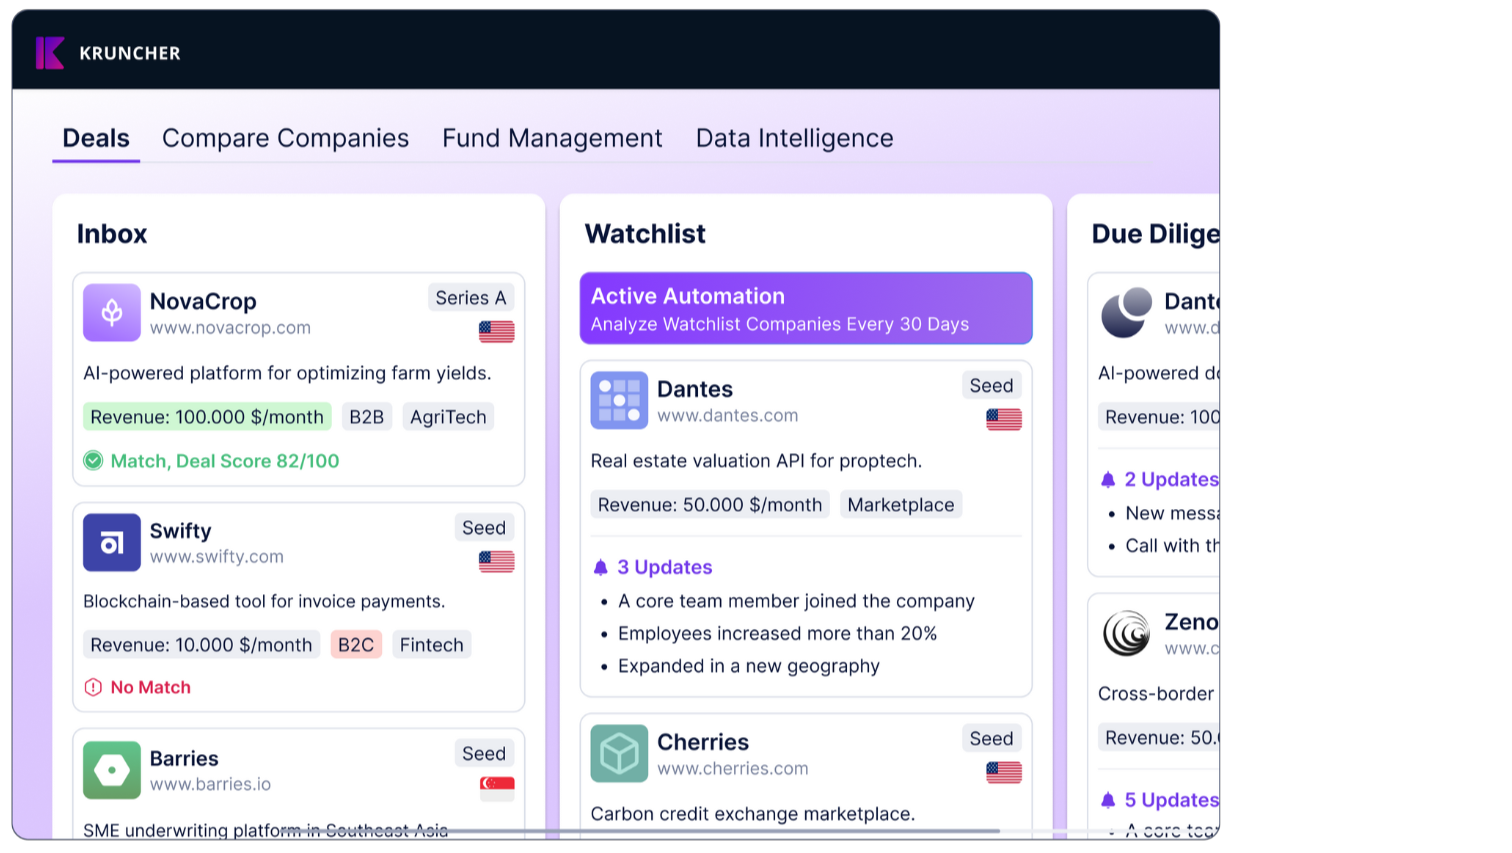
For example, this is how Watchlist monitoring may look like:
To do this, you need to toggle on automations for your Watchlist or Portfolio.

This will automatically re-run ALL company analysis in your Watchlist/Portfolio every 1/2/3 months, giving you growth and decline signals and a numerical growth score.
Growth Score is a percentage number (%), both positive and negative. The higher the number, the better and faster growth rate that company is showing. Negative numbers means the company is de-growing, or in other words, declining.
Complete List of Signals
Kruncher automates your monitoring with over 438 recognized metrics and signals that it tracks.
An additional layer of intelligence also works out what is important, ensuring that you only get key updates and not minor, noisy notifications.
Monitoring then becomes systematic, tailored to each company, and ready for partners, boards, and LPs, without manual spreadsheet work.
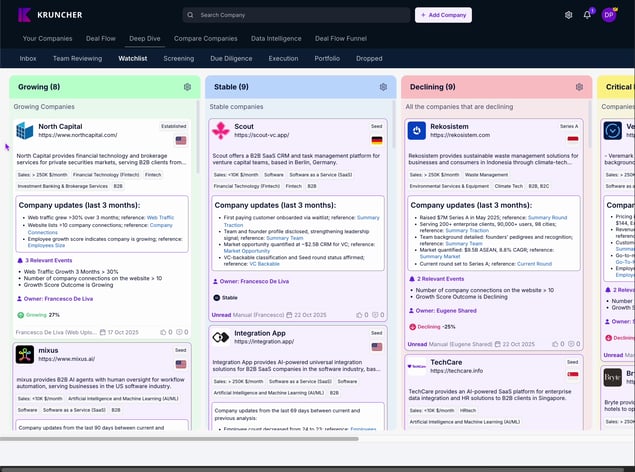
This is what that monitoring and signals may look like in practice:

Customizing Tracked Signals
Make Kruncher work exactly like your fund by aligning your definition of positive and negative signals. Customize the signals that Kruncher tracks and assign them sentiment values.
To start, go to Settings (⚙️) -> Track Company Events on the left tab, or click here.

Kruncher has already have some set up by default. You can add, edit, and remove tracked signals/events to fine-tune this system.
Read this guide to learn more about customizing signal tracking.
Growth Score, Alpha Reports, and Generating Alpha
A basic guide to the universe-level layer of Kruncher.png?width=1522&height=687&name=universe%20(1).png)
A. The frame: why this layer exists
Most private market tools answer the question "Is this one company interesting?" Kruncher's first layer (single-company analysis) does that well, and it's where almost every customer starts.
But serious investors don't operate one company at a time. They operate a universe: a watchlist, a portfolio, a sector, a competitor set. Two hundred companies. Two thousand. Sometimes more. The actual question they live with is harder:
Across everything I'm tracking, where should my attention go this week?
Generating alpha, in Kruncher's vocabulary, means answering that question systematically rather than by gut. The Growth Score is the input. The Alpha Engine (externally called Market Intelligence, per section 6.5) is the workflow. Alpha Reports are the output.
This guide walks through all three.
B. The Growth Score: what it is
The Growth Score answers a single question for every company in the universe:
Which companies deserve attention today, based on actual momentum?
It's not the Deal Score. Deal Score asks "does this fit my thesis?" Growth Score asks "is something happening here right now?" The two are designed to be used together, and that pairing is where alpha lives (more on that in section 5).

How it's calculated
Kruncher tracks 400+ signals across hiring, revenue, funding, web traffic, product, news, and team composition (per section 6.4, the four trigger categories: People, Liquidity, M&A, Business Deals). The Growth Score rolls these signals into a single number that reflects whether a company is accelerating, holding steady, or declining.

Each customer chooses one of two configuration modes:
Automatic. Managed by Kruncher. No setup. The system benchmarks each company against its industry and stage peers, detects what's changed since the last analysis, and improves over time as the customer thumbs signals up or down. This is the right default for most teams in the first 90 days.
Manual. Granular control. The customer picks the signals, sets the weights, defines the thresholds, and decides when an alert fires. Used by funds with a sharply defined thesis where "momentum" means something specific (e.g. "a 15% headcount jump in engineering matters; a 15% jump in sales doesn't").
Both modes draw from the same 400+ signal library. The difference is who decides what counts.
What goes into the score
Customers configure the metrics that signal company momentum and progress. Typical weightings look like:
| Metric | Typical weight |
|---|---|
| Customer Growth (12 months) | 20% |
| Employee Growth (3 months) | 20% |
| Revenue Growth (3 months) | 20% |
| Customer Growth (3 months) | 10% |
| Customer & Partner Logos Growth (3 months) | 5% |
| Job openings growth (last month) | 5% |
| ...plus additional signals per firm | balance |
These are configurable. The point of the framework: every company in the universe gets scored on the same yardstick, so comparisons are honest.

Why this matters for the investor
Without a Growth Score:
- Coverage is anecdotal. The companies that get attention are the ones someone happened to remember.
- Momentum is invisible until it's already priced in.
- The team's prioritization is a function of who shouted loudest in the partner meeting.

With it:
- Every company in scope is ranked on the same basis, refreshed continuously.
- The top of the list is where the team starts the week.
- Quiet companies that are quietly accelerating get surfaced before anyone else sees them.
C. The Universe Over Time view: momentum is a verb
A score is a snapshot. Alpha is in the change.
The Universe Over Time view (the scatter plot with the time slider) plots every company in the universe on two axes: Growth + Deal Score on the vertical, employee count on the horizontal. The slider lets you walk through weeks or months. Companies that moved up are marked green with an arrow showing previous → current; companies that moved down are marked red. Echo dots show where they were last step.
This is what "see velocity, not just position" means in practice. Two companies sitting at the same point today look identical on a static spreadsheet. On the Universe Over Time view, one might be climbing fast and the other quietly drifting down. You see it immediately.
This is the kind of view market data platforms (Pitchbook, Crunchbase) structurally cannot produce. They offer point-in-time snapshots. Kruncher offers the evolution (per section 4.8.5 on the time-series moat).

D. Alpha Reports: structured outputs from the universe
An Alpha Report is what a customer receives on a recurring cadence (typically every 90 days, configurable) showing what changed across the universe and what to do about it. The six-step structure the platform follows is:
- Universe. The set of companies in scope (e.g. "Watchlist 1: 142 companies").
- Objective. What we're monitoring for (e.g. "new AI investments in fintech"). Data refresh cadence is set here.
- Ranking. How the cohort is ranked. Typical: growing fastest, raising soon, exit-ready.
- Segments. Sub-groupings so the ranks make sense within peer groups (you don't compare a Series A to a Series D directly).
- Deepdive. What the analysis pulls per company. Typical: funding trajectory, growth rate, hiring acceleration, signal density.
- Report. The output, delivered every 90 days via email and WhatsApp (or routed however the customer prefers).

Each Alpha Report tells the customer three things:
- What changed. The companies that moved meaningfully since the last report.
- What it means. The signal pattern behind each move (e.g. "Series A vintage, 35% headcount growth, two senior engineering hires from OpenAI").
- What to do. The shortlist for outreach, the shortlist to discard, the shortlist to monitor more closely.
This is the contrast to a generic AI tool, which produces text, or a market data platform, which produces a list. Kruncher produces a scoped decision queue.
E. Generating alpha: the Rank Companies workflow
This is where the Growth Score and Deal Score combine to do real work.
The Rank Companies view (the Deal × Growth scatter plot) is the single highest-conviction artifact in the Alpha Engine. Mechanics:
- X axis: Deal Score. "Does this fit our thesis?"
- Y axis: Growth Score. "Is this accelerating?"
- Upper-right quadrant (Deal 80–100, Growth > 20): Investment focus. High thesis fit AND positive momentum. This is where alpha lives.
- Lower-left quadrant (Deal < 50, Growth < 0): Companies to discard. Poor fit AND declining. Free your team from looking at these.
The platform lets you act on the top and bottom 5% directly. From the Investment focus list: pull the report, draft the outreach. From the Discard list: archive in one click.

The cognitive value is clean: instead of "go through 700 companies and decide," the workflow is "act on the 35 that matter." That's a 95% compression of attention onto the highest-EV decisions.
What makes this hard to do without Kruncher
You'd need:
- Continuously refreshed signal data on every company in the universe (not snapshots).
- A scoring framework configured to your specific thesis (not a generic database).
- The ability to rank companies side by side on the same yardstick.
- Outputs that compress decisions, not just data dumps.
Funds attempt this in Excel. The pattern (per section 6.5) is that customers say "I have been trying to build this for two years." It doesn't work because the data layer doesn't update, the thesis filter is a person's memory, and nothing scales.
F. The compounding effect
The Growth Score isn't static. Every time the team thumbs-up or thumbs-down a signal, every time a deal score weight gets adjusted, every time a memo is generated, Kruncher captures that inside the customer's isolated tenant. Over six to twelve months, the Growth Score starts reflecting how this specific fund defines momentum, not a generic benchmark.
Two funds tracking the same company will see two different Growth Scores because they've trained the platform differently. This is the compound moat (section 4.8.6): proprietary intelligence that didn't exist on day one and can't be replicated by switching tools.
G. When to introduce Growth Score and Alpha to a customer
Per section 6.5, this layer is operationally delicate. Not first-call material in most cases. The right sequence:
- First demo: single-company analysis. Get them to "I want this on my next deal."
- Second meeting: their universe pre-loaded. Show the Rank Companies view on their own watchlist. Then the Alpha Engine clicks.
A generic Alpha demo on someone else's data is interesting. An Alpha demo on the customer's own thesis ("here are the 12 robotics companies in your watchlist showing fundraising-imminent signals, ranked") is unforgettable.
H. The one-line summary
The Growth Score tells you which companies in your universe are moving. The Rank Companies view tells you which of those moves matter for your thesis. The Alpha Report turns that into a decision queue you can act on every 90 days. Together: see more, understand faster, decide with confidence.