These guides cover the basics of understanding and configuring Kruncher for portfolio management.
GUIDE INDEX- Portfolio Monitoring Overview
- Part 1. Configure portfolio monitoring
- Part 2. Understanding the Growth Score
- Part 3. Generate the portfolio report with a Claude skill
Portfolio Monitoring Overview
Portfolio monitoring is the part of the investment workflow that quietly breaks every quarter. Founder updates arrive late, in different formats, or not at all. Internal data sits across email, drives, and decks. When the LP update is due, the team spends two to four weeks reconstructing what the platform should already have.
Kruncher fixes that by treating every portfolio company as an always-current profile, refreshed automatically, with a Growth Score that tells you which companies are healthy, which are drifting, and which need attention now. Once that data layer is in place, Claude generates the quarterly report on top of it in roughly twenty minutes.

This guide walks through the three steps in order:
- Configure portfolio monitoring so every company stays current.
- Read the Growth Score so the team knows what to focus on between updates.
- Generate the portfolio report through a Claude skill connected to your Kruncher tenant.
If you'd like to configure Kruncher's portfolio monitoring for your fund's specific reporting cadence or LP requirements, schedule a call with our team.
Part 1. Configure portfolio monitoring
What "portfolio monitoring" actually does
Kruncher runs the same structured analysis on each of your portfolio companies on a cadence you control, typically monthly or quarterly. The same data layer that produced the original report keeps producing it, and tracks how every metric evolves: headcount, web traffic, hiring activity, customer logos, fundraising signals, competitive moves. Per section 6.3 of the Kruncher Reference Guide, the customer experience is straightforward: every portfolio company is always current, and the quarterly review becomes a moment to discuss what the platform has already surfaced.
There are three things to set up.
1.1 Confirm your portfolio companies are tagged correctly

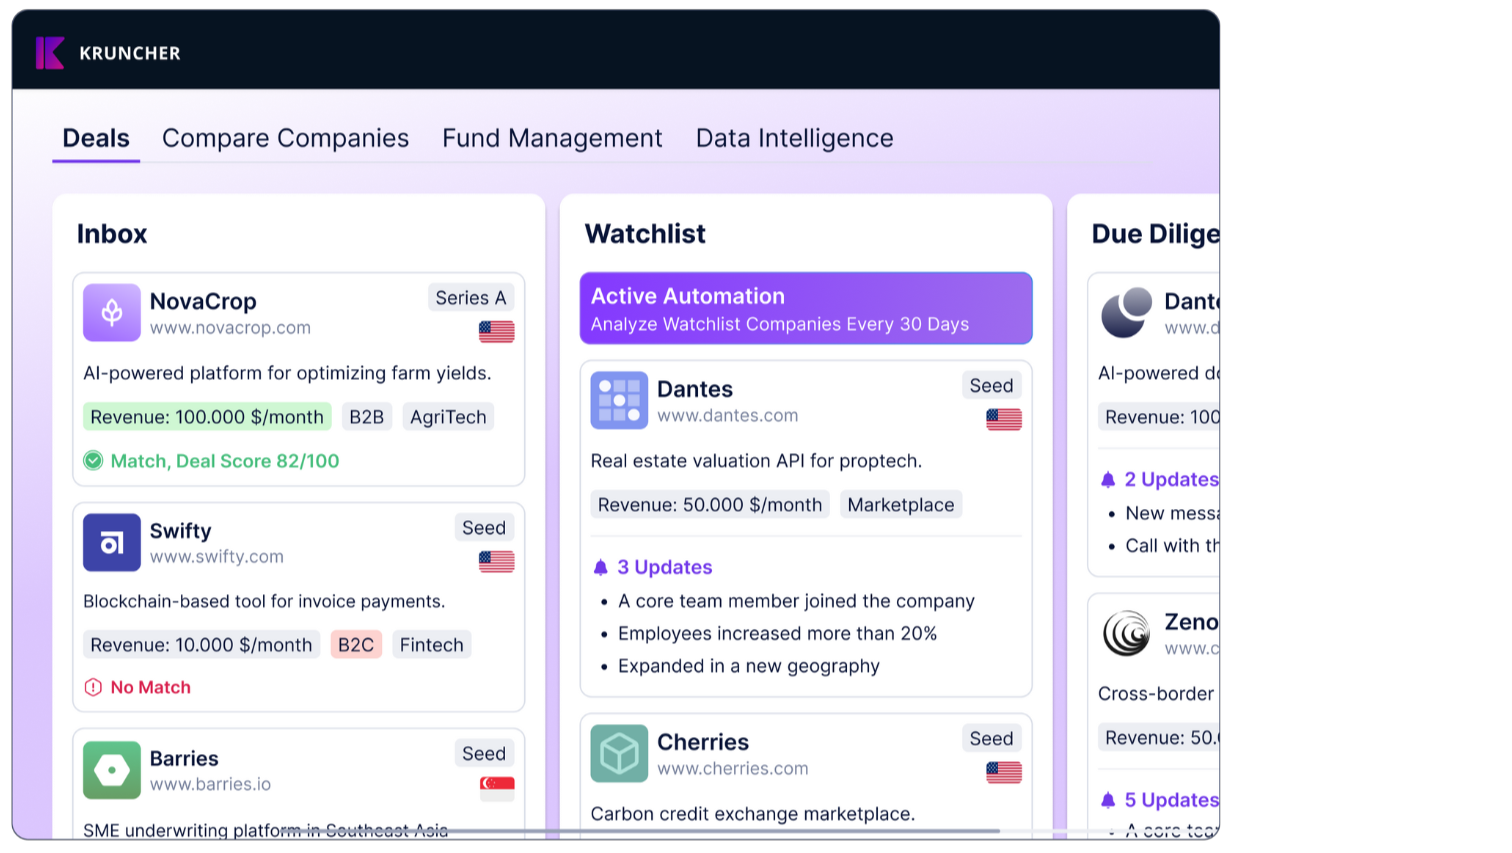
Open the Deal Flow tab in Kruncher and click on the Portfolio column. Every portfolio company should appear there. If a company you have invested in sits in a different stage (Screening, Due Diligence, Execution), move it into Portfolio so the monitoring engine picks it up.
If you have multiple funds, use project lists to separate them (one list per fund). The portfolio report can then be generated per fund, which matters for LP-specific reporting.
A common cleanup item the first time through: a few companies will be in the wrong column because of legacy entries. Fix these once and the rest of the configuration compounds cleanly.

1.2 Set the refresh cadence
For each portfolio company, click the gear icon on the right of the company view, then go to the Automation section. You will see options to rerun the company analysis on a recurring basis: every month, every quarter, or on demand.
For a working portfolio of 10 to 20 companies, the recommended default is:
- Monthly refresh if the team wants to catch changes between board meetings.
- Quarterly refresh if the team is using Kruncher primarily to support LP reporting and IC checkpoints.
Set the cadence consistently across the portfolio. Mixed cadences create comparison problems later when ranking companies side by side.

Why this matters: not every founder sends an update on time. Some never send one. Setting a recurring refresh means Kruncher keeps the profile current from external sources (news, hiring signals, web traffic, social, registry filings) even when the founder is silent. The portfolio review stops depending on founder cooperation.
1.3 Wire up founder updates
Two ways founder-provided data enters Kruncher.
Direct upload. When a founder sends a deck, financials, or a monthly update, drop the file into the company profile via "Add documents." Kruncher reads it, extracts metrics, and merges them into the time series. PDFs, Word docs, Excel, and CSVs all work. CSV should be saved as Excel before upload to avoid formatting issues during ingestion.

Email forwarding. This is the option to set up properly because it removes manual work permanently. Each Kruncher workspace gets a dedicated inbound email address. When you point a founder update mailbox at that address (or configure a forwarding rule from your team inbox), every update lands in Kruncher automatically, gets attached to the right company by domain, and the profile refreshes.
If the team is receiving updates over email, that's the perfect setup.
If the founder forget to share updates you can configure the followup:


1.4 Common configuration pitfalls
Per section 6.3 of the Reference Guide, two things are worth avoiding from the start.
Skipping the cadence step. Without a recurring refresh, monitoring degrades to manual lookups, and the LP report rebuild starts from scratch every quarter. Set the cadence on day one.
Treating portfolio data as if it were public. Portfolio company data sits in your isolated Kruncher tenant. NDAs with portfolio companies may constrain what can be aggregated externally; the configuration should reflect that. If a company has restrictions on what their data can be combined with, flag it in the company profile and limit the aggregated views accordingly.
Part 2. Understanding the Growth Score
What the Growth Score is
The Growth Score is Kruncher's continuous, evidence-based read on whether a company is moving forward, holding steady, slowing, or in serious trouble. It is not a deal score (which is your investment-thesis fit at the moment of evaluation) and it is not an opinion. It is a structured signal built from time-series data across the dimensions Kruncher tracks for every company.

Each portfolio company sits in one of four Growth Score outcome buckets:
- Growing. Multiple dimensions trending up over the recent period. Hiring acceleration, web traffic gains, product or customer momentum, capital events.
- Stable. No material decline, no material acceleration. The company is operating but not breaking out.
- Decline. One or more dimensions trending materially down. Hiring slowdown, traffic erosion, logo churn, executive departures, or other negative indicators.
- Critical. Concentrated negative signals or specific red flags that warrant attention now, not at the next quarterly review.

What feeds into the Growth Score
Per section 6.1 of the Reference Guide, the growth indicators Kruncher analyzes include:
- Employee growth by department, with velocity measured against peers.
- Open job postings, treated as a hiring-intent signal.
- Website traffic trends, broken down by organic and paid.
- Social media follower growth.
- Customer review sentiment.
- Logo and partnership tracking.
- Funding history and runway implications.
- Executive moves and departures, especially in key roles.

The score is not a single number plus a threshold. It is a structured read across these dimensions, weighted toward velocity (rate of change) rather than absolute levels. Two companies at the same employee count today look very different if one took two years to get there and the other took eight. Velocity is itself a signal (section 4.8.5).
How to use the Growth Score in practice
There are three workflows where the Growth Score earns its keep.
Triage between board meetings. Open the portfolio dashboard and sort by Growth Score. Companies in Decline or Critical get a thirty-minute review now, not in three months. Companies in Growing get a check on whether the firm should follow on or introduce to potential customers. Companies in Stable get left alone until the next refresh.
Pre-IC and pre-board prep. Before any IC or board meeting, scan the Growth Score and the "What's new" view for the company in question. The platform has already aggregated the last three months of changes (hiring, traffic, news, signals). The prep work is reading and interpreting, not assembling.
LP reporting context. When the LP asks "how is the portfolio doing?" the Growth Score gives a defensible, evidence-linked answer: this many Growing, this many Stable, this many Decline, this many Critical, with the underlying time series available for any company the LP wants to drill into. Per section 4.8.4, every data point carries a timestamp and a source, so the answer holds up to scrutiny.
Look at your Portfolio in aggregated way
Kruncher allows you to look at aggregated view of all the portfolio companies in a qualitative way:

and qualitative way:

Discover more by looking at the alpha engine: https://kruncher.ai/app/alpha-engine/
A note on what the Growth Score is not
It is not a valuation call. A company in Decline may still be worth its current mark, and a company in Growing may be overpriced. Valuation is a separate analysis (the portfolio-valuation skill handles this when needed). The Growth Score is the input that flags which companies need that deeper analysis.
It is also not a substitute for founder conversations. A Critical-flagged company should trigger a call, not an email. The Growth Score tells the team where to focus; the team still does the judgment work.
Part 3. Generate the portfolio report with a Claude skill
Why use Claude for this layer
Kruncher is purpose-built to standardize and aggregate every company's underlying data. Claude is purpose-built to take that structured data and shape it into the exact document the team needs: a quarterly portfolio update, an LP letter section, a one-pager per company, a board-ready PDF.
The split is intentional. Kruncher handles the data heavy lifting: ingestion, scoring, time-series, sourcing, lineage. Claude handles the last mile: the firm-specific format, the logo, the tone, the structure your LPs are used to seeing. Each tool does what it is best at.
The integration is through the Kruncher MCP server, which exposes your Kruncher data to Claude securely, inside your tenant.
3.1 One-time setup: connect Claude to Kruncher
In Claude, open the Connectors menu (the small button at the input bar) and add the Kruncher connector. Claude will prompt you to log in to your Kruncher account once. After that single authentication, the connection persists.
Once connected, Claude can read your Kruncher data on demand (companies, reports, growth scores, signals) and write back where authorized (saving insights, adding comments to a company activity log).

3.2 Install the portfolio report skill
A Kruncher skill is a saved instruction set that tells Claude exactly how your firm wants its portfolio report generated. Think of it as a configurable template plus a workflow: which companies to pull, which sections to include, which format to output, which dates and naming conventions to use.
Your account manager will share the latest skill file directly. The current version handles the full quarterly portfolio assessment workflow, with the firm-specific configuration you specify (fund split, included companies, output format, recency rules, summary structure).
Loading the skill in Claude takes thirty seconds: paste the skill file into the Skills section in your Claude project. The skill is then available to trigger by name in any conversation.
3.3 Generate a report
In a Claude conversation with the skill loaded and the Kruncher connector active, the workflow is:
- State the intent: "Run the quarterly portfolio assessment for our portfolio."
- Claude pulls the current Kruncher data for every portfolio company in scope (typically 10 to 20 companies).
- Claude applies the analytical structure defined in the skill: per-company summary, Growth Score read, key updates since last quarter, risks, recommended actions, valuation context where relevant.
- Claude outputs the document in the format you chose: Word, PowerPoint, Excel, or all three.
Total time end to end is roughly twenty minutes for a 10 to 20 company portfolio. For reference, one fund running this workflow with 130 portfolio companies (per section 6.3 wow-moment example) used to spend two weeks every quarter on this report; with the skill in place, the work compresses to a single working session.
3.4 The typical output structure
Most firms configure the report to produce three artifacts each quarter:
- One slide per company. Used for the IC and board readout. Standardized layout, key metrics, Growth Score, headline risks and wins.
- One long document with full detail. Used as the source-of-truth analytical record. Per-company narrative, full evidence trail, sourced numbers, recommended actions.
- One Excel summary. Used as the schedule of investment with current fair market value, key updates, and Growth Score column. This is the format LP-facing fund admin teams typically want.


Below you can find an example of a claude code skill used by Kruncher with our Kruncher MCP connected to Claude. Similar behaviour can be achieved with ChatGpt.