Kruncher is able to automatically categorize your watchlist companies as Growing, not growing but not declining (Stable), Declining, and companies that has had a critical event(s) happened to them.
When active, this categorization appears as a positive or minus percentage score on the company cards, or in your Deep dive -> Watchlist view.

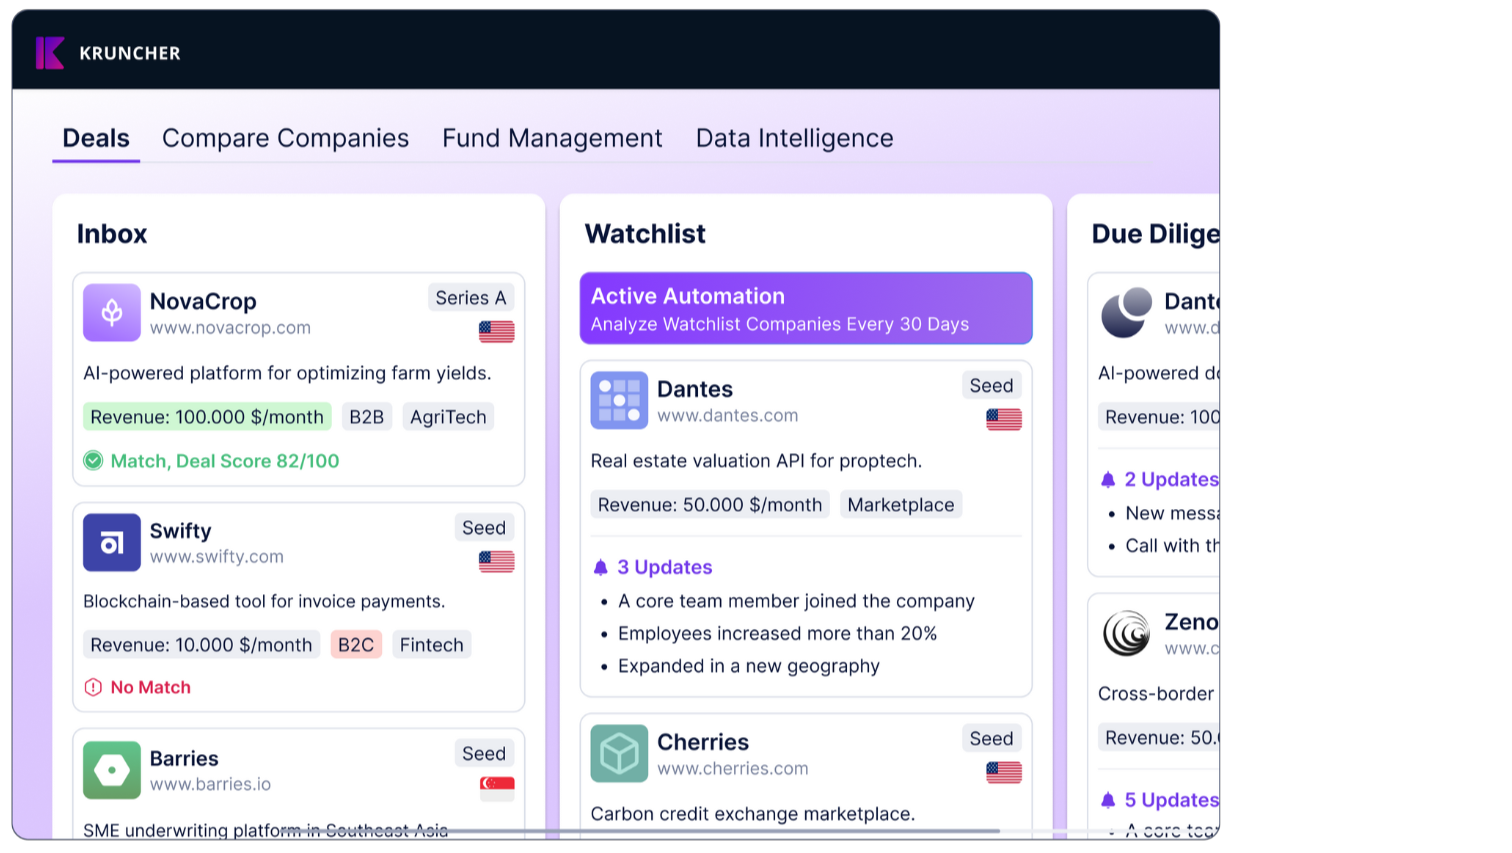
This is what that view looks like:

Let's learn how to enable this feature, since Kruncher does not have it on by default.
1. Enable Watchlist Automation
First, you need to be in the Board view of your Main board.

In the Watchlist column, click the lightning icon besides the Settings icon (x).
A pop-up will appear. Toggle on the first option, Analyze company every...

Select whether you want Kruncher to re-analyze every month, or every quarter.
Click Save.
Close the pop-up. The lightning icon is now purple, indicating that the automation is now active.

Now, let's learn where you can access this view.
2. Deep dive -> Watchlist
Go to your Deep dive tab (next to the Main board) and select Watchlist.

By default, Kruncher will make the categorization of Growing, Stable, Declining, and Critical Events for your watchlist.
Click Settings (⚙️) to edit how each category looks, the filtering logic, and whether to send you notifications when a company is categorized there.

A pop-up will appear. As a default, the Filter Criteria will be set to your Growth Score Outcome. If you are new to Kruncher, we suggest that you leave this as it is for now.
To enable email notifications, simply toggle on Notification and select which team member that will get the email.

Next, let's configure how Kruncher defines what signals counts as Growing, Stable, Declining, and Critical Events.
3. Customizing Growth Score Framework
Go to Settings -> Growth Score Framework on the left.

By default, Kruncher already set some metrics to calculate your growth score, but everything here can be customized as you like so Kruncher calculates Growth Score according to your definition of growth.
Let’s look at those customization options now. You can click + Add Growth Metric to add another metric of growth.
A popup will appear, asking you to pick the metric and its weight in percentage. A bigger weight means that metric matters more as a growth metric than others.
NOTE: Weights of all metrics must total exactly to 100%.

When done, click Confirm.
You will see your new metric added.
Next, you can edit or delete existing metrics on the Actions column. This will open up the same pop-up as before, for that metric.
You can also see when your Growth Score Framework is last edited, and by who.
Finally, set your Reference Values to tell Kruncher from what point on should a company be considered as Growing or Declining.

Select the percentage value from the dropdown. For now, the percentage for both Growth and Decreasing Threshold cannot be more than 50%.
4. Understanding Growth Score Framework
Growth Score is a percentage number (%), both positive and negative. The higher the number, the better and faster growth rate that company is showing. Negative numbers means the company is de-growing, or in other words, declining.
By metrics set by you in the Growth Score Framework, each company is automatically assigned one Growth Score.
Let's understand how Kruncher determines which companies are categorized as what. As a baseline, Stable is a Growth Score of 0%.
In your Reference Values, you set the threshold in which Kruncher defines a company as Growing or Declining and not Stable anymore after it crosses a percentage value.
As an example, let's define Growing companies as any company that has a Growth Score above 20%. This means that companies will only be categorized as Growing if it has a Growth Score above 20%.
Similarly, let's define Declining companies as any company that has a Growth Score below 10%. This means that companies will only be categorized as declining if it has a Growth Score lower than -10%.
That means, every company with a Growth Score in the range of -10% and 20% is defined as Stable.